To support the growing database, we have had to make some significant changes to the way d-portal imports data from the IATI Registry with the first move being a new server that has a larger capacity and faster speed to accommodate the current and potential future size. The old server was also dangerously close to being out of storage space which resulted in a slow response time when you browsed through the website.
With increased capacity, the new server performs a full import considerably faster than it used to; just 3 hours instead of 3 whole days. This is made possible with support for parallel importing - instead of importing 1 activity per second, we are now able to import over 100 activities per second.
Result data
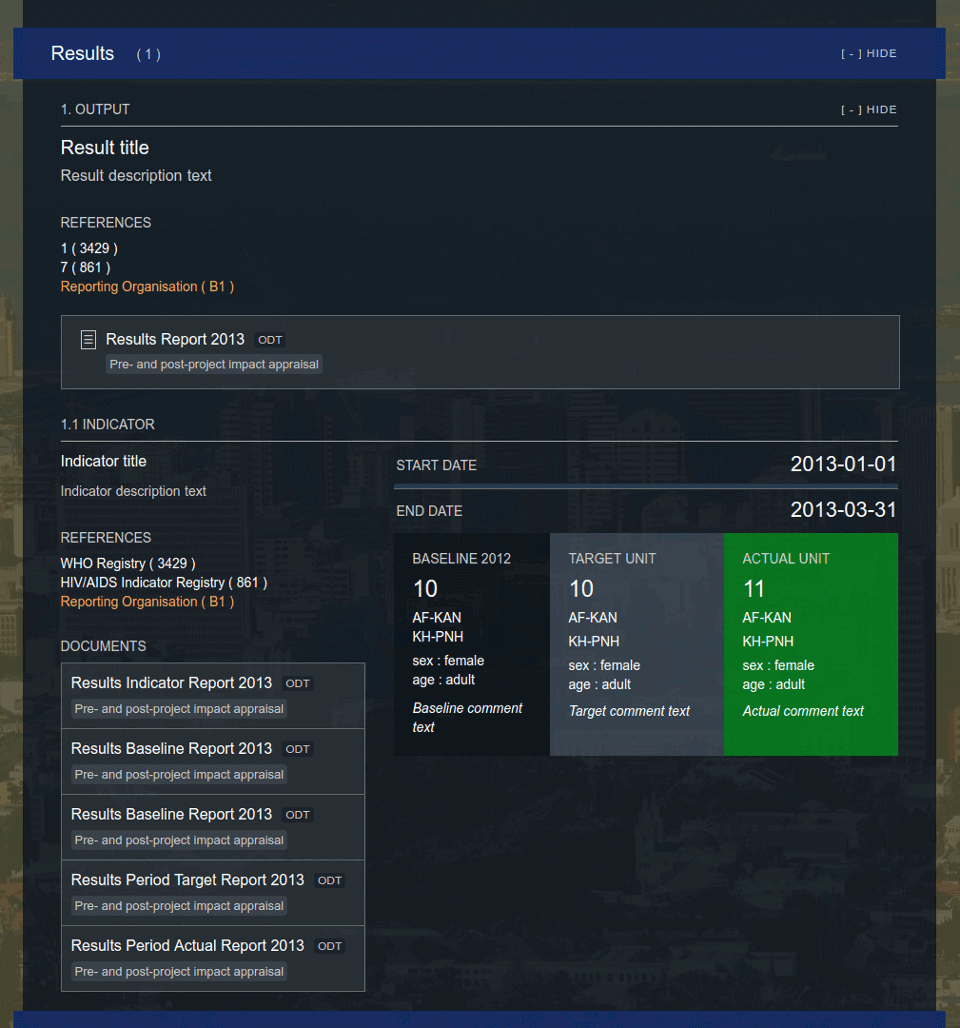 Figure 1. Updated display of result data with support for 2.03 on SAVi
With the new version 2.03 upgrade, there has been some considerable updates to the result element in the standard. This means the current method of displaying result data also needs updating. Many thanks to this Github issue, we were able to accommodate those changes to better support the new version.
Dataset logs
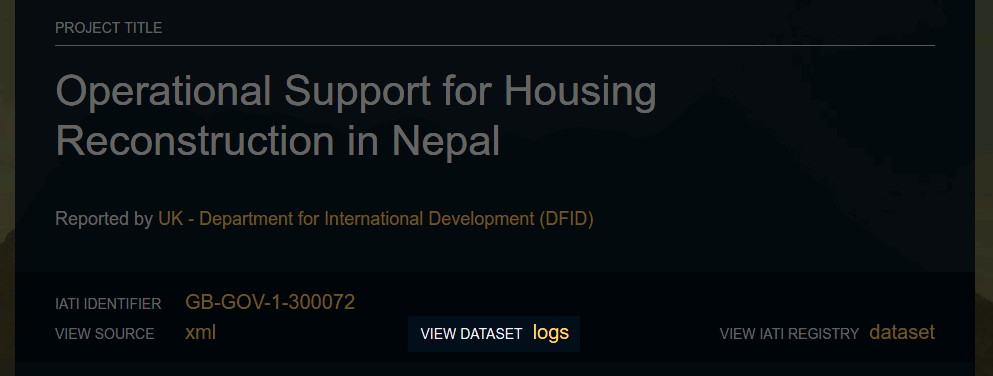 Figure 2. Dedicated dataset logs on Dash screenshot
There is now a link to the d-portal logs of each dataset on the SAVi pages of each activity. A dataset is a valid XML file imported from a organisation's server that contains a number of activities. You can view this particular one here.
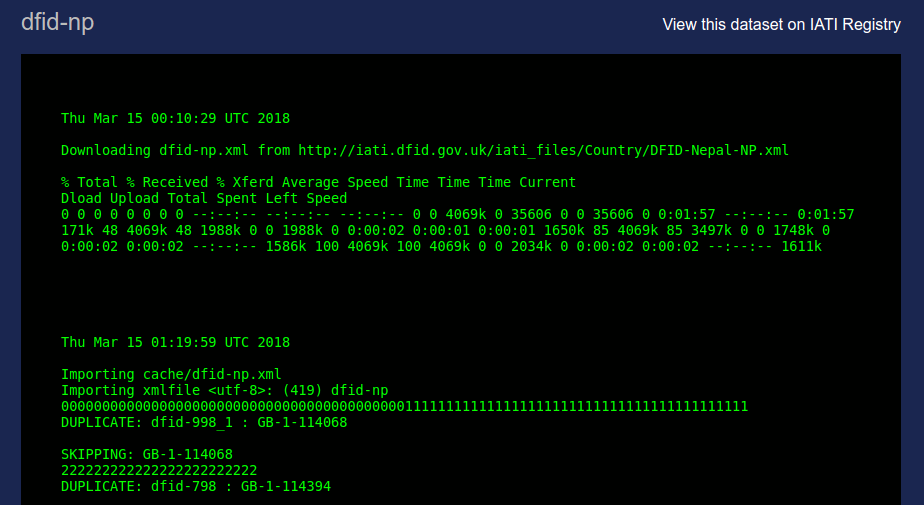 Figure 3. A daily log of 1 imported dataset from the registry
Clicking through the dataset log link will direct you to a page where
you are able to check for any problems that may have arose during the
last import. These imports are done nightly so we have the latest data
on d-portal. Problems may include download or import errors and
duplicate activity identifiers, which are quite common and can easily
cause missing data on d-portal.
Dash
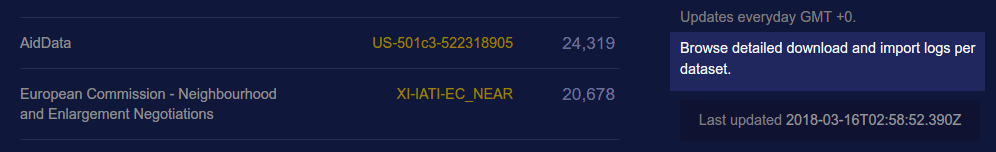 Figure 4. Link to full list of imported datasets
There is now a link to view all the imported datasets and their logs on the front page of Dash. Dash is an overview of the data populating d-portal. We use it primarily to double-check instances where d-portal isn't displaying information as expected.
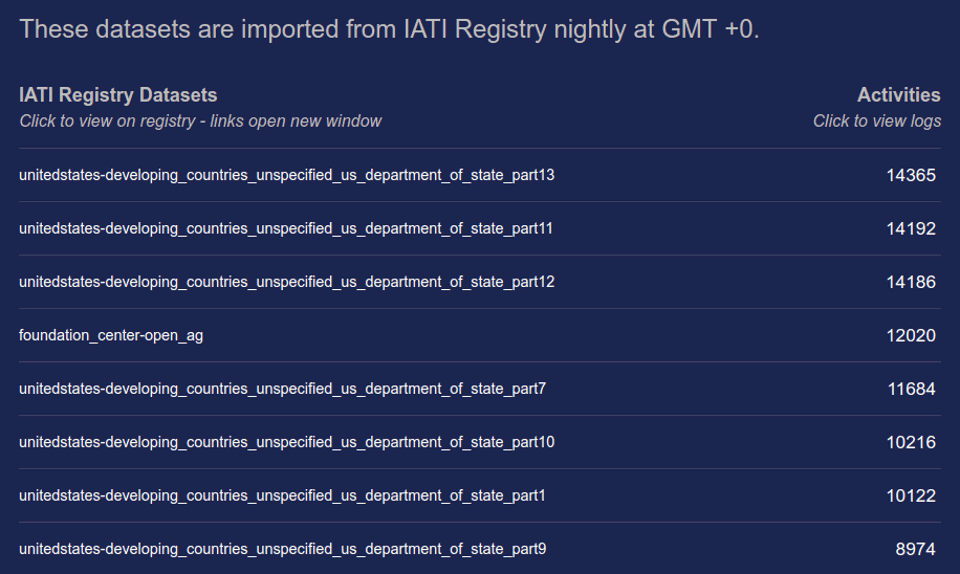 Figure 5. List of all imported datasets with links to IATI Registry and
dataset logs
Figure 5. List of all imported datasets with links to IATI Registry and
dataset logs
Clicking through the link will direct you to the full list of all datasets that have been imported from IATI Registry. This list allows us convenient access to links and logs to track down problems with the imported data.
Let’s take a look at a few of these problems in the examples below.
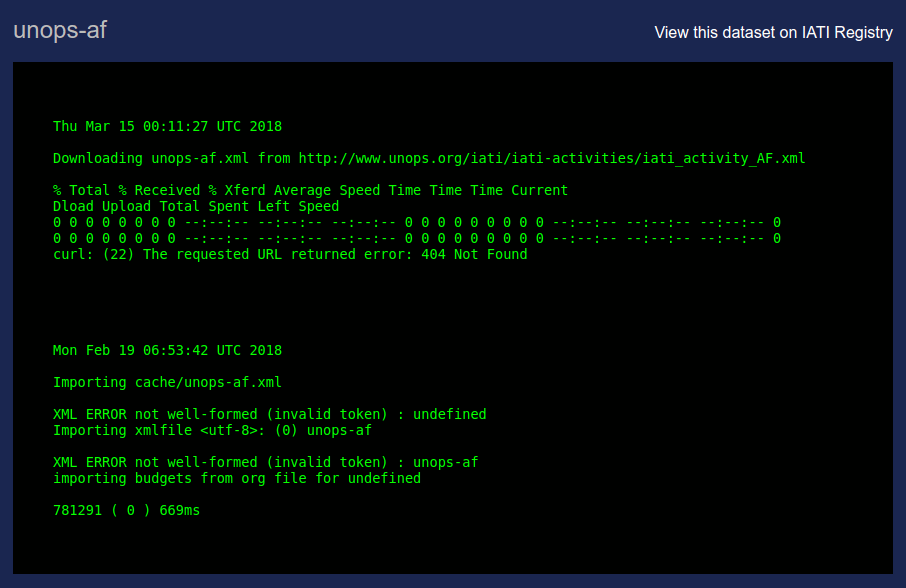 Figure 6. An example dataset that could not be downloaded
You can easily see what went wrong in this example - we were unable to download the dataset from the source server (the requested URL returned error: 404 Not Found). This means the data will not be imported into the d-portal database and so will be missing from the website.
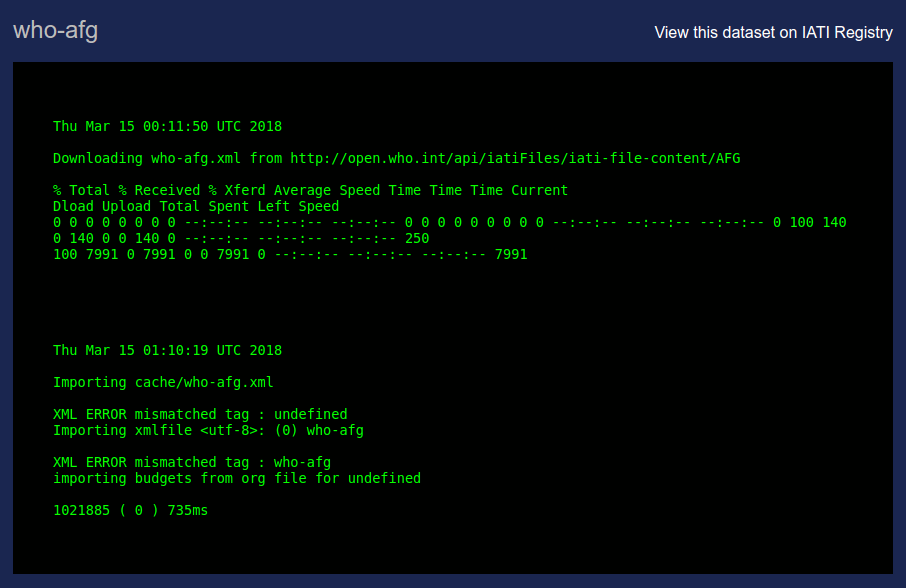 Figure 7. An example dataset that did not import
This dataset downloaded fine from the source server but it faced problems during the step where we import it into the database. By visiting the url at the top of the logs, we are able to find out why. In this case, the downloaded dataset was not an XML file.
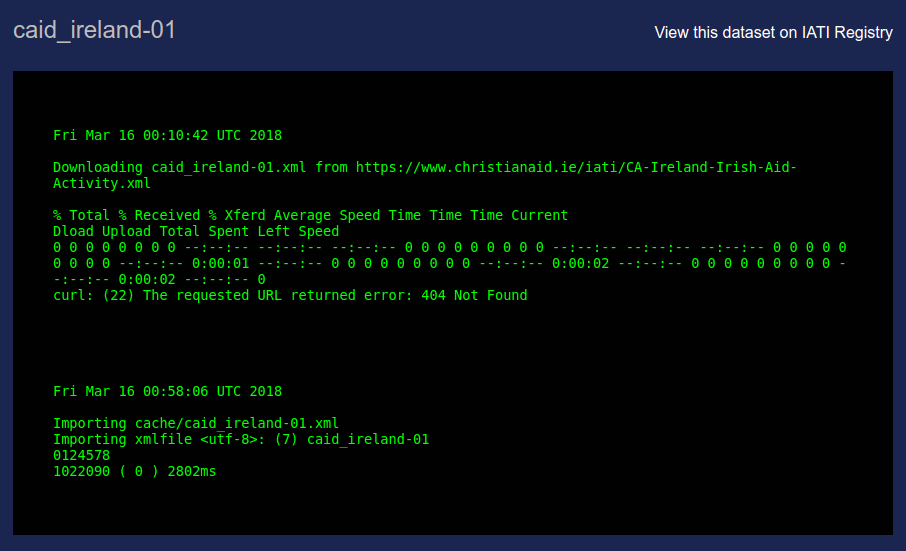 Figure 8. An example dataset failed download but imported fine
This dataset was not available from the organisation server but we had a cached version on our server so we were able to import the cached version into the database for display.
For such cases, we assume this is an intermittent error which will be fixed shortly by the organisation. In the meantime, we will use any cached files to populate d-portal.
Cron logs
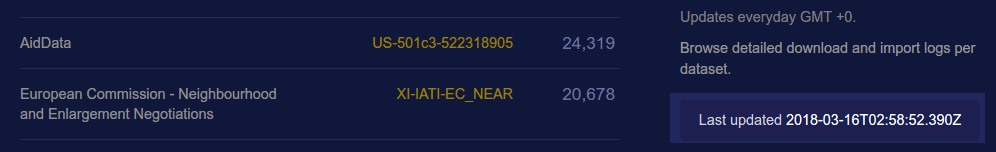 Figure 8. Link to the nightly cron logs
Logs of nightly imports can be viewed on the front page of Dash. The time stamp shows the last time the nightly script was run.
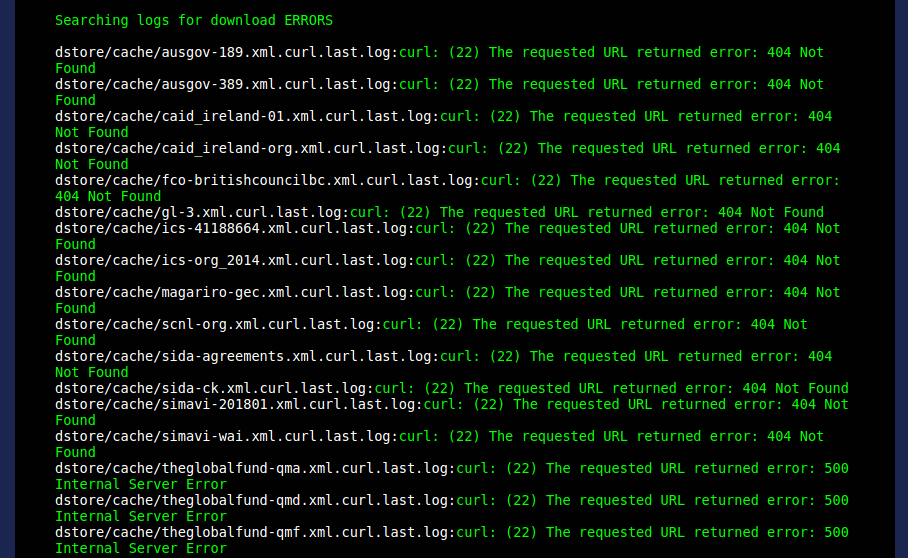 Figure 10. Errors now link to the specific logs
We’ve added a small update to how messages are displayed here. Errors found in the cron logs now link to specific database logs for easy access. This makes the process of checking individual links to error messages much more efficient.
This concludes some of the more recent technical updates for d-portal. If you'd like to know more, do join in the discussion on GitHub. We look forward to hearing from you.