Results data heirarchy is not particularly verbose.
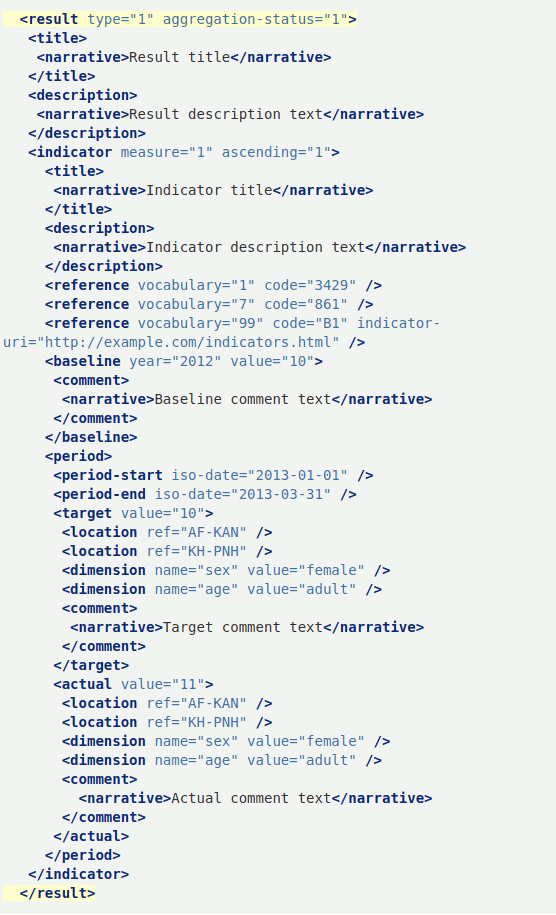
Fig. 1 The results element heirarchy
At its most basic, there is a title, description and an indicator. The indicator makes up most of the results element with links to reference documents, a baseline and the all important period element. Here in the period element will contain the start and end dates, target and actual values and within those, location and dimensions data like sex, gender and age. Dimensions data is freetext so there are no restrictions to what a organisation can well, publish. Due to this, data within this element might be difficult to aggregate.
There are also multiple narrative and comment elements within the results subelements. We found that organisations tend to repeat themselves rather than add new information in these sections.
SAVi displays complex-looking IATI XML (the elements found in a single activity) in a format that is hopefully, easier to read and digest. To achieve this, we try to understand the context of the data being used and how best to lay it out so that it makes the most sense to the casual user. Thus far, we're only showing the most commonly used elements of the IATI schema, which means there are still parts of the XML hidden from view on SAVi pages. This doesn't mean we've changed the original XML in any shape or form (you still have access to this via the xml link on each SAVi page) but it does mean there are still many parts of the iati-activity element that we've not fully understood or explored. Hopefully, as more elements get adopted by organisations, we'll get the opportunity to delve deeper into use cases that are in demand.
When we were first asked to display results data in SAVi, we misunderstood it entirely! Without context or how and what it was used for, a structure to compose a visual layout was at most, based on assumptions.
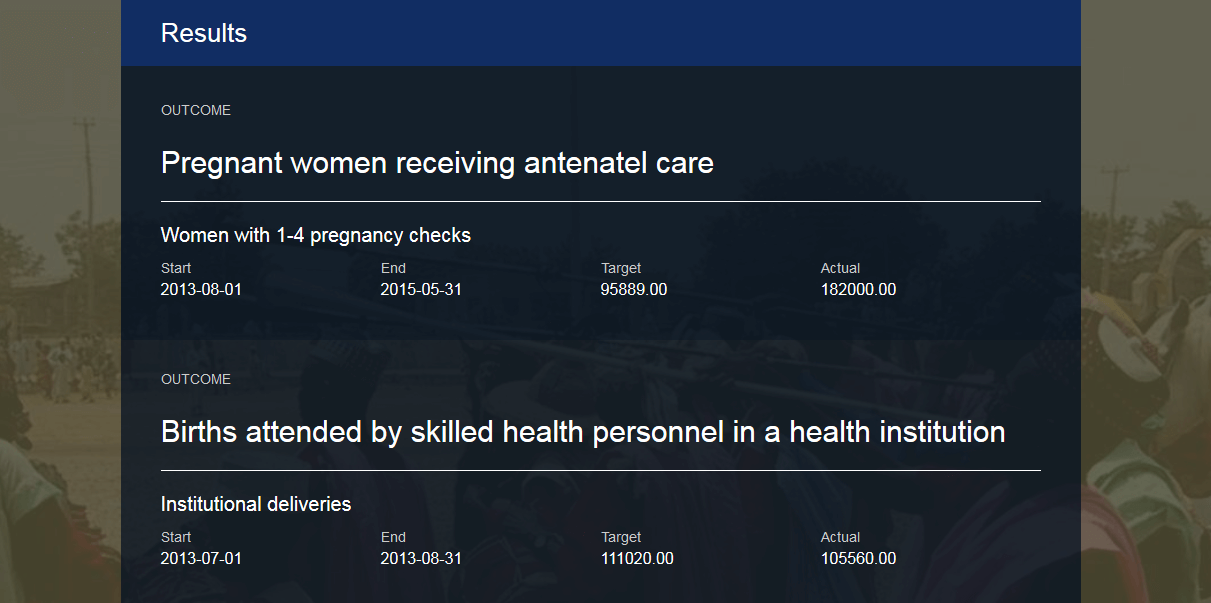
Fig. 2 First iteration of results data saw a rudimentary layout without
baseline data
The first thing we had to do was find some actual results data to work with. Preferably an activity with most of the results subelement completed; this seemed a harder feat than we thought.
I visited the IATI Dashboard to point me in the right direction. The dashboard has been really useful in terms of finding organisations using certain elements, especially so for SAVi as we're always trying to visualise certain sections of an activity and this always meant looking for example data. The only thing I wish the dashboard would do was display the full organisation name or even their reporting-org id instead of their IATI Registry id as that would not only save me one more step (currently, I have to click on the organisation link to find out the actual organisation name) but it would be consistent with other parts of the dashboard website where the full organisation names are displayed.
In any case, there was still a lot to do after this to find an activity that has a high completion of the result subelements. This prompted us to add a new query parameter to Q which is live right now on d-portal. Give it a go!
http://d-portal.org/q.json?from=element&orderby=element_volume-&limit=10&element_name0=result
The above query will display the top 10 activities that contain the 'result' element in descending order of frequency as JSON. Replace .json with .html, .xml or .csv if you prefer.
The query is 4 levels deep, this is enough to reach the deepest part of the IATI standard. For example, if I want to search for activities that have dimension data within the target element of results data, my query will look like this:
As you can see, the query starts with the innermost element and you'll need to list the hierarchy as it appears in the standard.
We started going down the route of deeper searches into attributes but this is a rather resource hungry option so we've taken it out for now. If there are demands for such things in the future, do let us know.
During the four-day Open Ag Tool workshop, we met experts in the field who gave us guidance on approaching results data. Nadeja Mandrescu from Development Gateway not only shared how results data was published and how baseline was calculated, she also explained how different organisations had different approaches to publishing this data - Yearly, Quarterly etc. This gave us some context and a brief overview of the rather complex nature of the results data element.
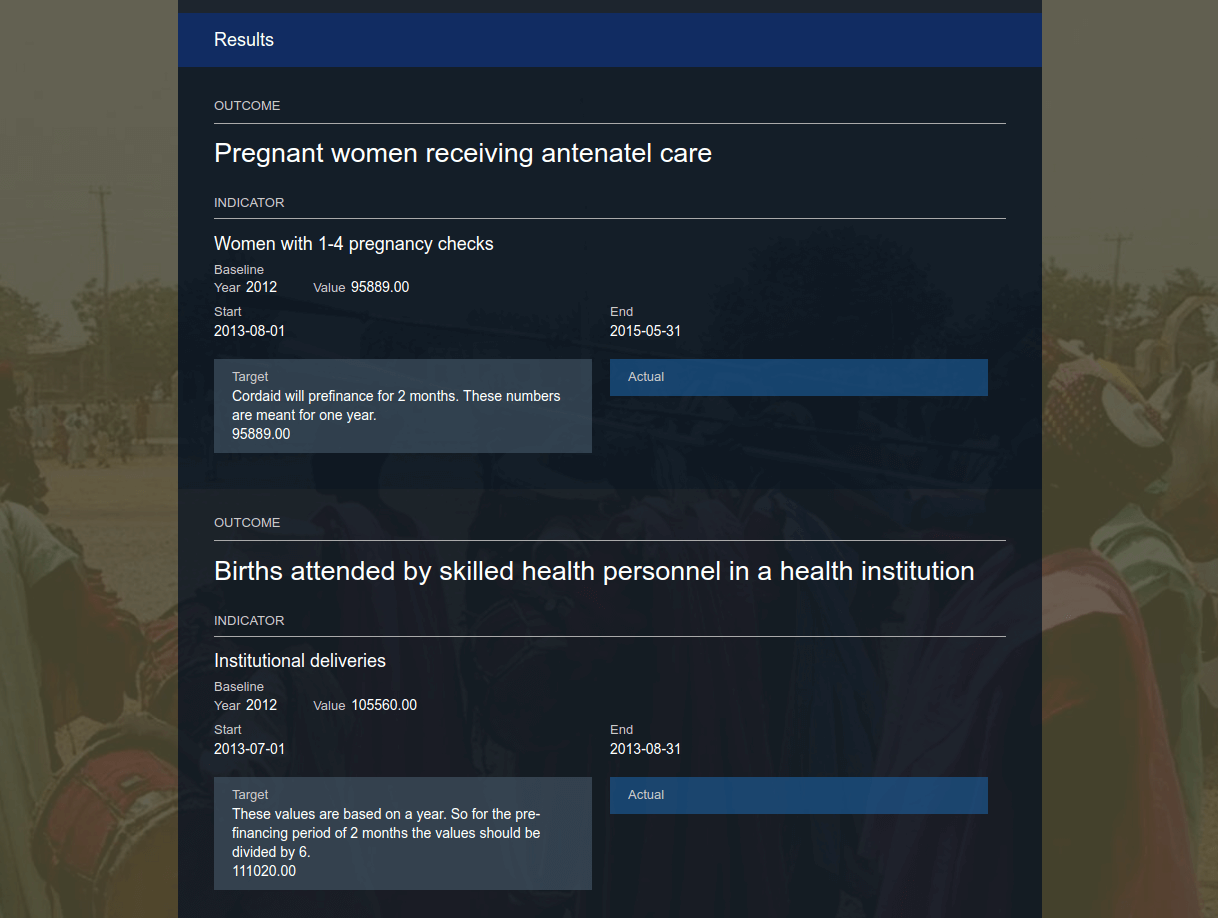 *Fig. 3 WIP iteration of results data with two columns made the baseline look
out of place*
*Fig. 3 WIP iteration of results data with two columns made the baseline look
out of place*
We were later approached by Andy Lulham from Publish What You Fund about the way we visualised baseline data (or rather, the lack of it)! He pointed out the importance of baseline data, how it provided context for the target and actual elements and how it would make better visual sense to include it alongside the two columns. This looked like it was getting somewhere close to making sense!
Looking closer, we agreed that baseline could be interpreted as the 'start' value where 'target' and 'actual' data is based on (hence, 'baseline').
Throughout the day, we huddled with so many exchanging findings. Nick Hamlin from Global Giving shared interesting observations when he applied machine learning to a results dataset we supplied him with. We both agreed that there is still the issue of what results actually mean to organisations and this interpretation affects the level of granularity being published. Reid Porter from InterAction shared at length the background of historical data and how things can get lost in translation when very complex multi-system architectures are used within organisations, to then derive standardised results data from these systems is a close to impossible feat. Taryn Davis from Development Gateway shared the need for visualisations and computing graphs from results data that could be viewed on an ag specific dashboard. We all agreed that numerical values in the target and actual elements were best to achieve aggregation than having text in there as well.
We prodded further and found that baseline years were usually in alignment with period-start years but also that at times, organisations were publishing more than one period within an indicator. In terms of hierarchy, baseline data sits outside the period element which means multiple periods share just the one baseline.
Visualising this as a three column layout will be tricky so we've duplicated the baseline element into each period element, after the period-start and period-end dates. This meant the 3 columns could be used to compare values within the period element and visually, that made sense.
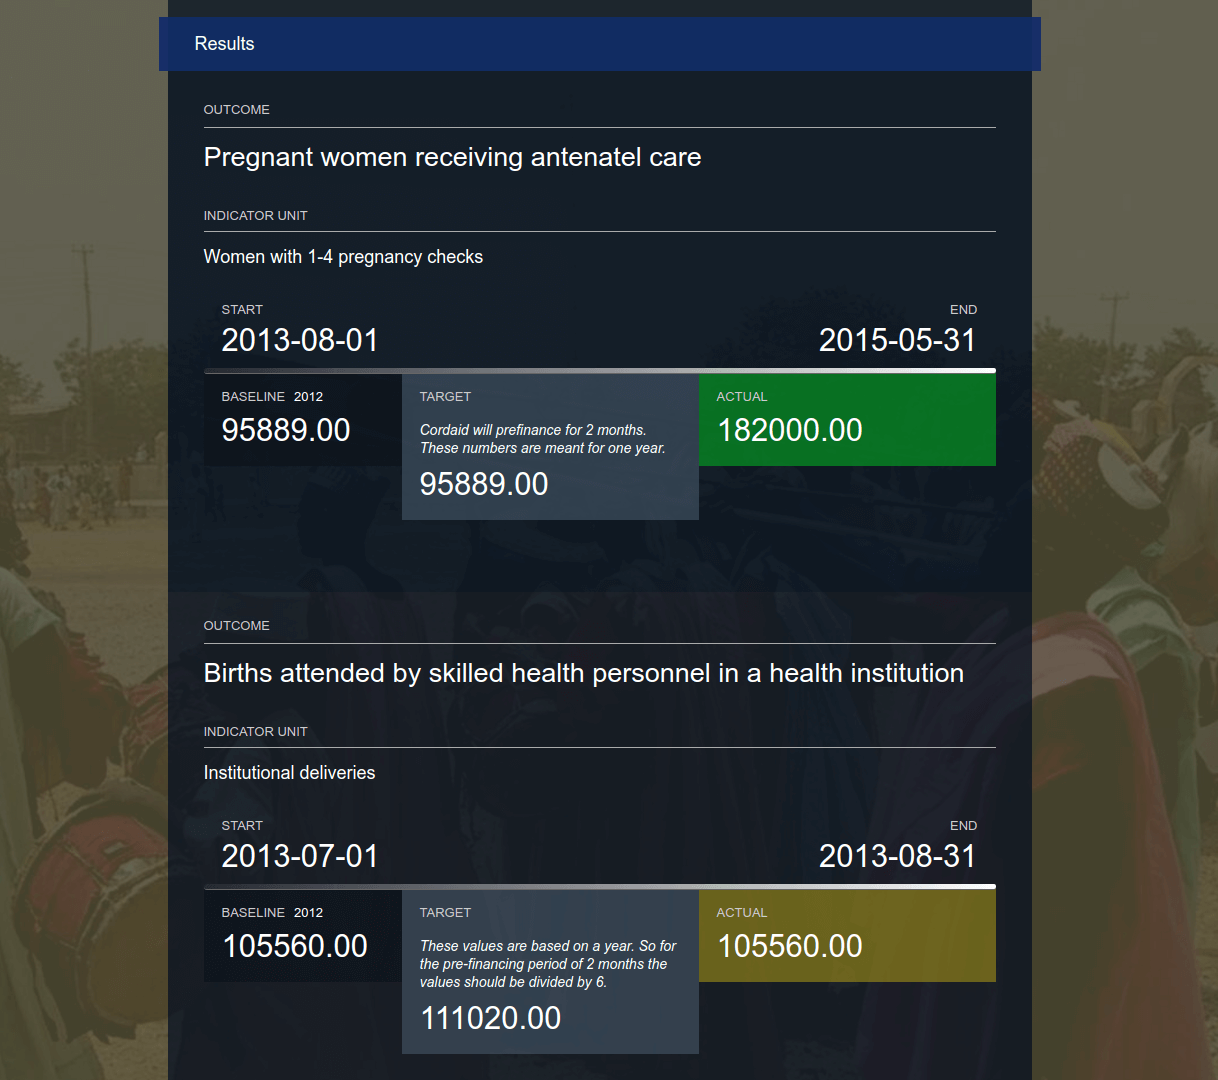 *Fig. 4 Next iteration of results data with 3 columns for comparison*
We've attached further visual feedback to the actual elements; green if the actual value is equals to or more than the target value and off-yellow for actual values that are less than the target value. The actual box remains neutral blue if value data is missing or incorrect; ie. text is published instead of actual numbers.
We've also added a small indicator to show if the period data is still ongoing or has ended. This is represented by a 'progress bar' timeline underneath the period dates.
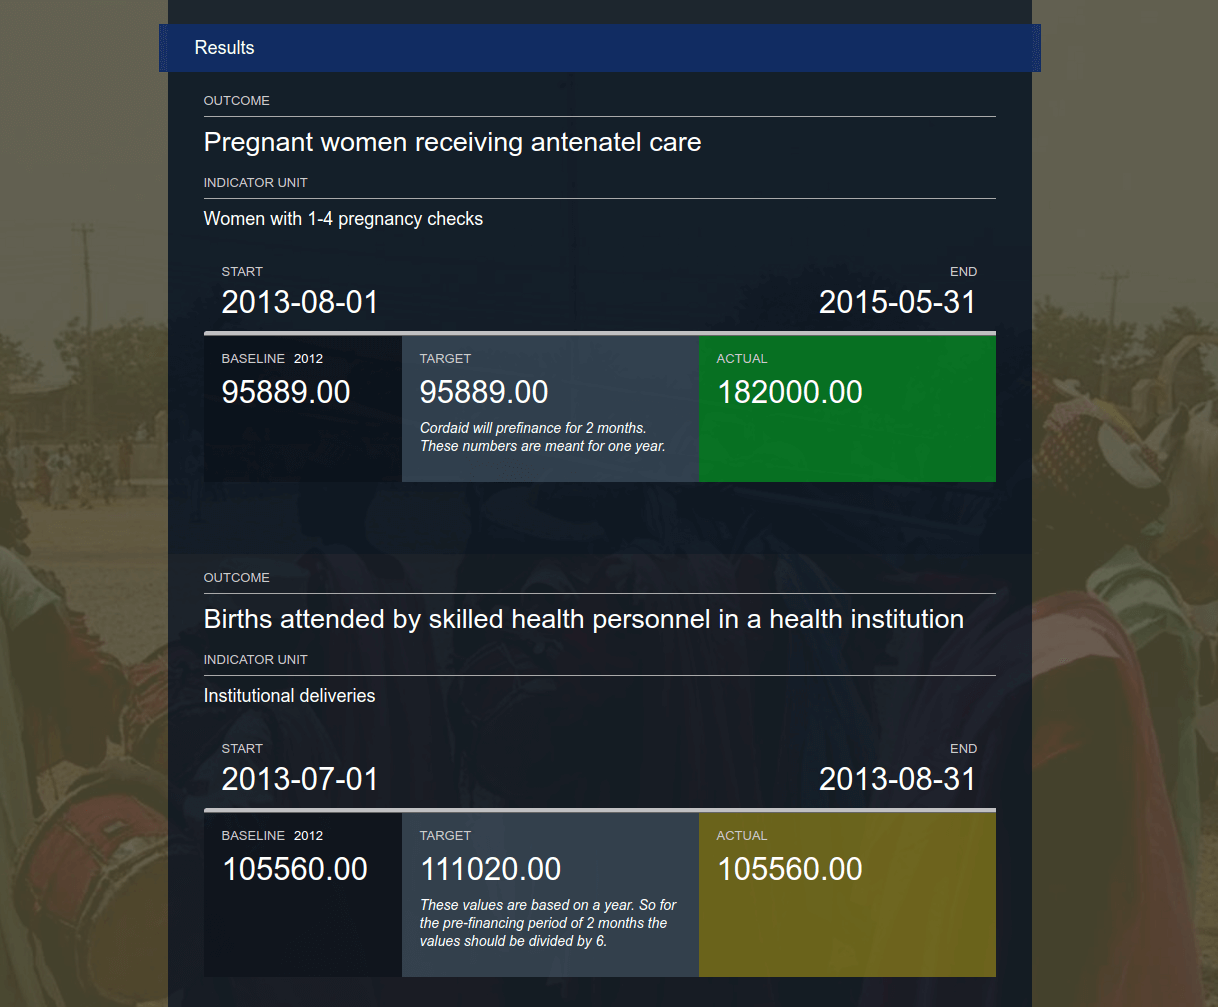 *Fig. 5 Current iteration of results data with fixed height and timeline bar*
You can view this particular example activity on d-portal here.
Results data with indicators and values are now live on d-portal and further iterations will continue as we get a better understanding of how to present the data for use.
Many thanks to the organisers of the workshop and everyone who came up to us to share knowledge, it was humbling and eye-opening to see so many dedicated people working together towards the same goal with so much enthusiasm. We look forward to following the progress of all the resulting projects and outcomes of this workshop.